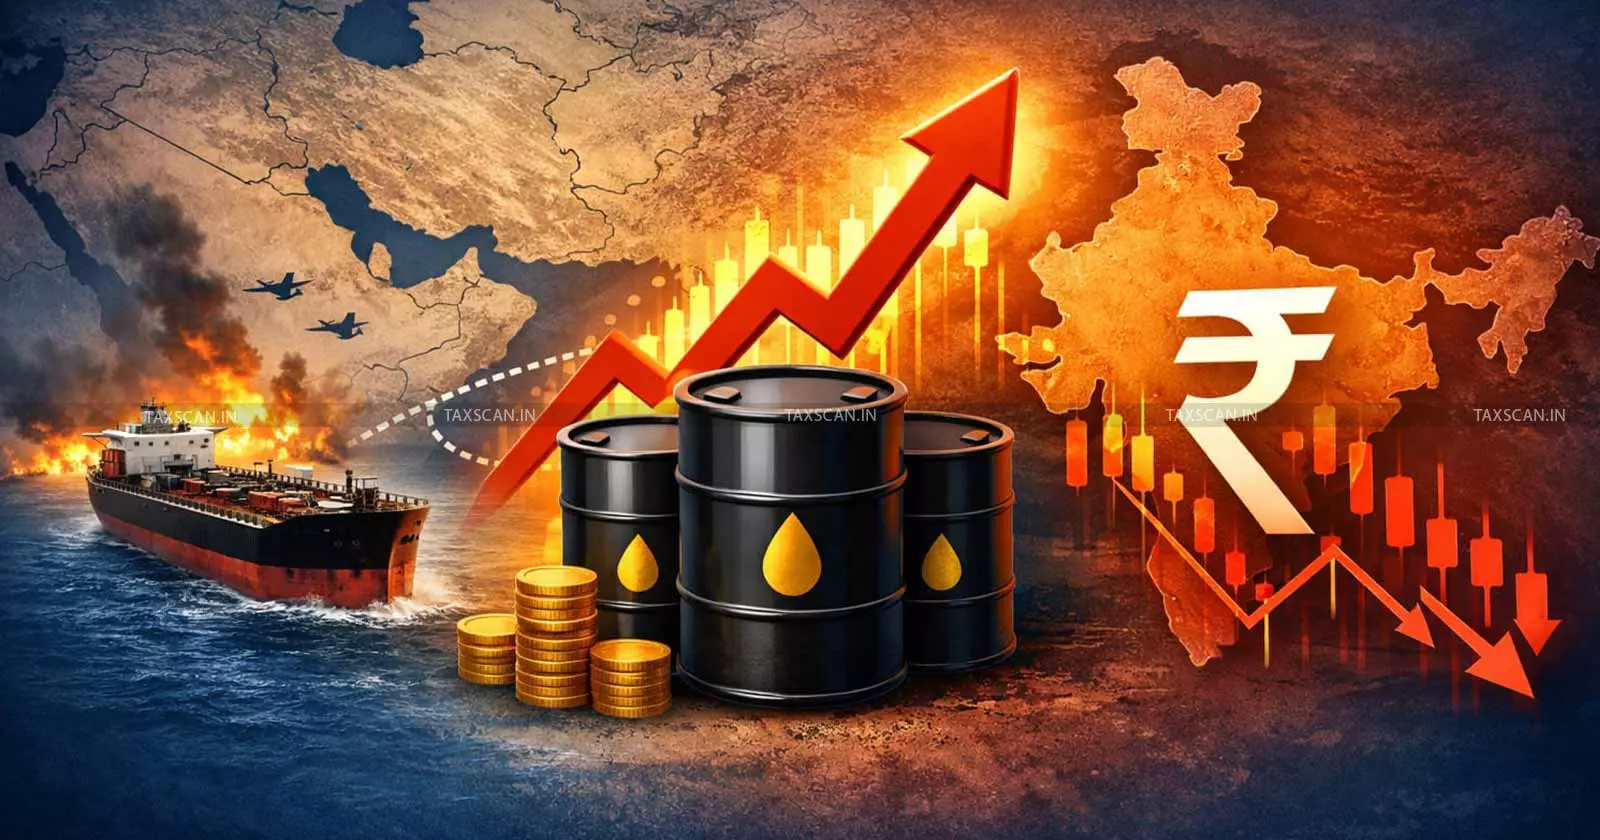
Oil Crashes to 8-Week Low as Trump Announces Iran Peace Deal — S&P 500 Surges to Record High
Trump announces major US-Iran peace deal. Oil crashes 5% to $80, S&P 500 +1.9% to record. Strait of Hormuz reopens toll-free. Geopolitical shock is over. Here's how to position your portfolio now.
This is not a minor diplomatic event. This is the resolution of the single biggest macro risk that has haunted markets for the past three months. The Iran war has been creating a geopolitical premium in every asset class — oil, bonds, equities, crypto. That premium just evaporated in a single announcement.
The deal: what Trump just announced
Trump announced memorandum of understanding "largely negotiated" between US and Iran. Key terms: (1) Strait of Hormuz reopens toll-free; (2) US naval blockade lifted; (3) Extended ceasefire, including Lebanon ops; (4) Signing ceremony June 19 in Switzerland. Markets pricing as nearly inevitable. Oil crashed -5% to $80 (8-week low) on announcement.
Why markets rallied so hard
1. Oil collapse removes inflation expectations
Oil at $80 signals energy supply constraints resolved. Central banks concerned about sticky inflation from oil-supply disruptions. With Strait reopening, constraint gone. Lower oil = lower inflation expectations = higher probability Fed pauses rate hikes, eventually cuts. Single most important catalyst for equity upside.
2. Energy stocks allowed to normalize
Energy/oil producers suppressed by supply disruptions now ending. Energy becomes normal commodity with normal valuations. Triggers rotation out of energy into growth.
3. Geopolitical risk premium evaporates
Every asset priced with geopolitical buffer. Buffer is gone. It's like removing tax from every security overnight. Stocks, bonds, crypto all rally. Nightmare scenario (escalating conflict, blockaded Strait, $110 oil) now off table.
4. Global markets follow
Asian markets surged overnight.
Korea Kospi +6%+. Japan Nikkei +5%+. Synchronized global risk-on, not US-specific.
📊Oil 8-week low / S&P record high scorecard
Brent: $83 (8-week low, -10% from peak). US crude: <$81 (-12%). S&P 500: 5,554 (all-time high). Nasdaq 100: +3.1%. Oil support: $80, $75–$78. S&P resistance: 5,600. Technical: clean breakdown (oil), clean breakout (stocks). Divergence = regime shift.
What this means for Fed policy and inflation
Critical for June 16–17 FOMC meeting. Fed in bind: strong data suggests need to raise rates, but rates threaten growth narrative. Iran deal resolves dilemma. Lower oil collapses inflation expectations. PCE was sticky at 3.8% due to energy concerns. Now concerns gone, PCE should trend down. Gives Fed breathing room to pause hikes and eventually cut late 2026/early 2027. For traders: Fed likely to signal pause/cut at June meeting = 200bps rally in duration, additional 5–10% upside in equities.
The numbers: oil 8-week low, stocks record high
Oil breakdown: Brent $83 = 8-week low. US crude <$81. Both broke 50/200-day moving averages on volume. Support levels: $80 (psychological), $75–$78 (technical target), $70 (recession tail risk).
S&P 500 breakout: 5,554 all-time high. Breakout on expanding volume + 70% breadth (broad-based, not narrow). Resistance: 5,600, 5,650.
Divergence: Oil -10% from peak ($90→$81) while stocks hit record high. Rare pattern showing macro regime shift from inflation/risk-off to growth/risk-on.
Why this divergence matters more than you think
Past 3 months: oil up = stocks down (inflation fears, rate hike concern). Next 3 months (starting now): oil down = stocks up (deflation signal, rate cuts). This is regime change, not bounce. Energy → Tech leadership rotation now starting. Value → Growth rotation. Traders short tech need to reverse positions immediately.
The technical setup for the next 4 weeks
• Oil target $75–$80: Breakdown below 50/200-day MAs on volume = textbook. Next target 15–25% below breakout. Risk: deal unravels June 19, oil spikes $90.
• S&P target 5,600–5,650: Breakout at 5,554 on broad breadth. Next target typically 1–2% above breakout. Risk: Fed hawkish surprise June 16–17.
• Key dates: June 16–17 FOMC (dovish = 2–3% upside), June 19 Iran deal signing (escalation risk = 3–5% oil spike), June 30 Q2 earnings (growth season begins)
The reversal trade: what to do now
• Long QQQ: Tech rally just starting. Disinflation + rate cuts = bullish for growth. Overweight 20–30%.
• Short XLE: Oil breakdown = energy sector lag. Inflation hedge narrative dying.
• Long TLT: Bonds starting own rally as inflation fears fade. 5–10% gains likely over 4–6 weeks.
• Exit gold: Geopolitical risk + inflation hedges both dying. Close GLD longs.
• Buy the dip: Expect 1–2% pullback to 5,480–5,500 for S&P 500. Use as entries, not exits.
⚠️Risk management: what could break this trade
Iran deal unravels before June 19 = oil $90. Fed hawkish June 16–17 = growth rally stalls. Recession data surprises = demand destruction oil overshoots $70. Keep 10–20% dry powder for capitulation buys. Monitor Iran signing date closely for escalation risk
The bottom line
Oil at 8-week lows while S&P 500 hits all-time highs is not contradiction — it's repricing. Energy crisis ending. Growth narrative beginning. Traders pivoting from "long oil, short tech" to "short oil, long tech" will profit. Old regime traders will get run over. Technical setups clean (oil down, stocks up). Fundamentals clear (supply returning, Fed dovish). Main risk: June 19 deal re-escalation. Otherwise: oil $75–$80, S&P 5,600+ by early July.
Market divergences, technical breakouts, support/resistance zones, and position reversal opportunities — delivered daily so you never miss the next regime shift.

Frequently asked questions
Why is oil at 8-week lows while S&P 500 hits record highs?
Market repricing macro. Oil decline signals deflation (supply returning + geopolitical risk fading). Lower oil = lower inflation expectations = rate cuts = stocks rally on lower discount rates. Regime change from inflation-driven to growth-driven, not temporary bounce.
What are the technical targets for oil and S&P 500?
Oil: $75–$80 over 4–6 weeks (textbook breakdown). S&P: 5,600–5,650 (measured move from 5,554 breakout). Oil support: $80, $70. S&P support: 5,480 (20-day MA).
Should I sell my growth stocks at this record high?
No. Record highs on 70%+ breadth signal continued strength, not reversal. Technical setup favors longs through early July. Expect 1–2% pullbacks to use as entries. QQQ overweight remains appropriate.
When could this trade reverse?
Three scenarios: (1) Iran deal unravels before June 19 (oil $90, stocks -2–3%), (2) Fed hawkish June 16–17 (growth rally stalls), (3) Recession data surprise (PMI weak, demand destruction). Otherwise regime change holds through Q3.
What should I do with energy stocks?
Reduce to zero or short XLE. Energy outperformance was oil-driven. As oil reverses, XLE underperforms. Inflation hedge tailwind is now headwind. Exit or short.