Nifty’s 24,500 Breakout: Genuine Momentum or a Geopolitical Trap?
The Nifty 50 has finally breached the psychological 24,500 resistance. Retail traders are aggressively buying Calls, assuming the sky is the limit. But institutional data tells a different story. Discover how to use Option Chain Open Interest (OI), India VIX, and FII derivative data to determine if this breakout is a genuine momentum shift or a devastating geopolitical bull trap.
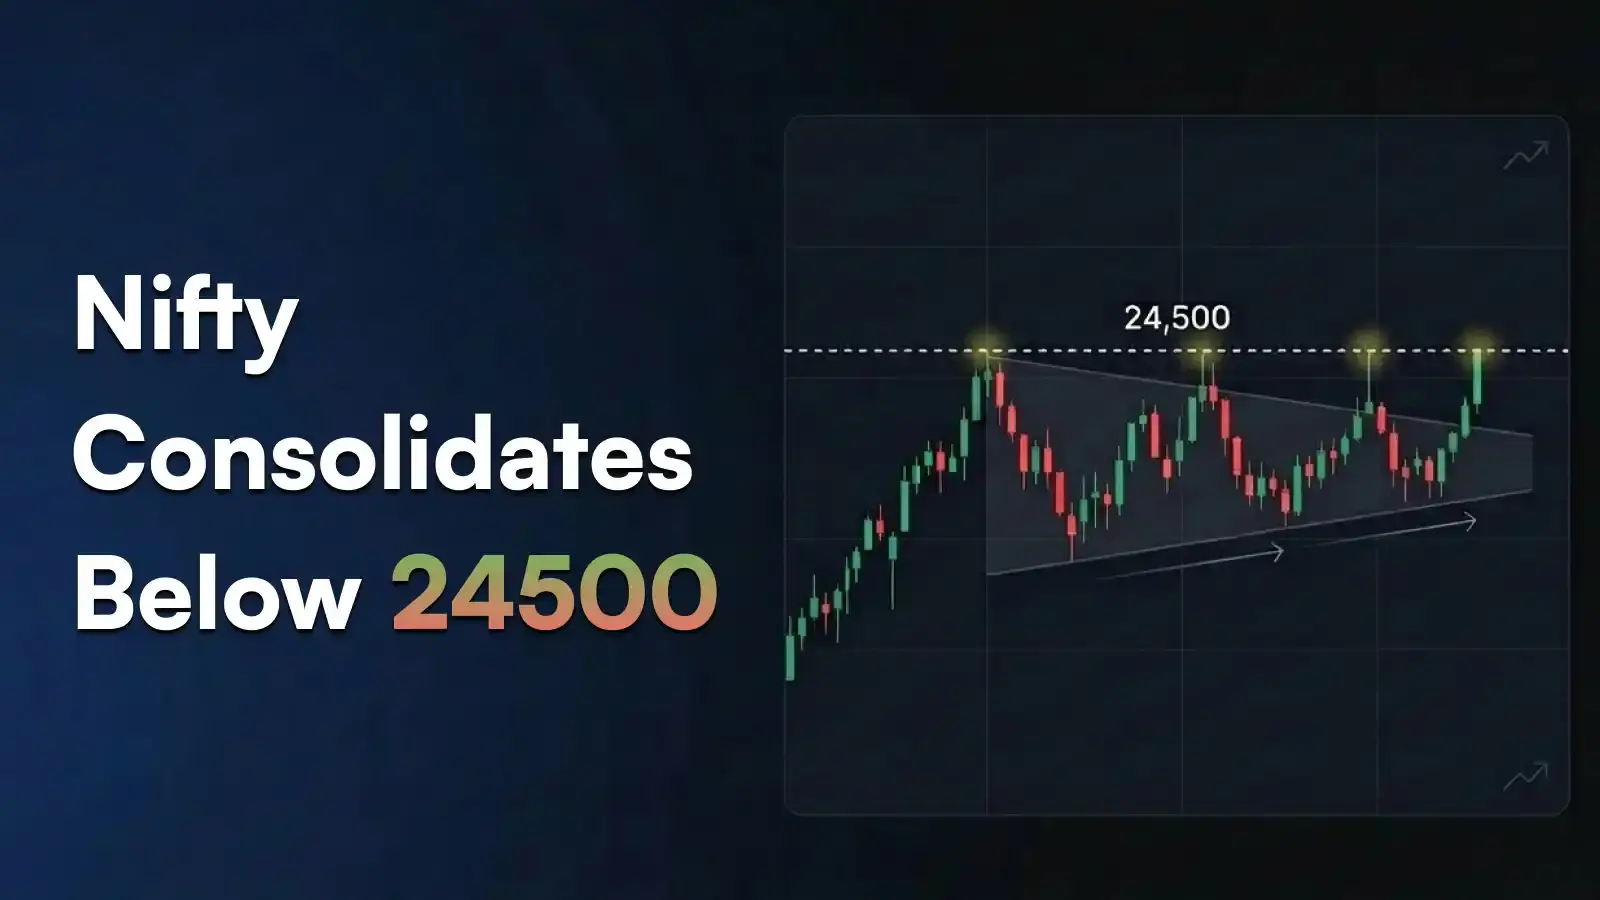
The Anatomy of a Breakout
In technical analysis, crossing a major psychological barrier like 24,500 on the Nifty 50 triggers automated buy signals across thousands of retail trading screens. The financial news channels flash green, Twitter gurus post rocket emojis, and retail capital floods into Out-of-the-Money (OTM) Call options.
But Dalal Street is not built to reward the obvious.
Statistically, over 60% of technical breakouts in major indices fail. They are engineered "liquidity grabs" by institutional players who need retail buyers to absorb their massive sell orders. To survive this 24,500 breakout, you must stop looking at the price action and start looking at the internal market mechanics.
The Psychology of the Plunge
In Part 1, we learned how to use Open Interest and VIX divergence to identify a fake breakout at 24,500. Now, let’s assume the trap is sprung. A geopolitical headline hits, FIIs dump their futures, and the Nifty slices back below 24,400.
Markets take the stairs up, but they take the elevator down. The speed of a failed-breakout crash is driven by trapped retail longs. Millions of amateur traders who bought 24,500 Call options are suddenly forced to panic-sell at market price to salvage their capital. This forced liquidation acts as rocket fuel for short-sellers.
But blindly buying Put options during a panic is exactly how amateurs lose money on the way down, too. Here is the institutional blueprint for shorting a failed breakout.
1: The Bear Put Spread (Controlled Aggression)
When the market drops violently, Implied Volatility (IV) spikes. This means Put options become incredibly expensive. If you buy a naked Put and the market simply chops sideways for two days, the IV will crush, Theta will decay, and you will lose money even if the market eventually drops.
The Execution: You deploy a Bear Put Spread. You buy an At-the-Money (ATM) Put option (e.g., 24,400 PE) to capture the downside. Simultaneously, you sell an Out-of-the-Money (OTM) Put option (e.g., 24,200 PE).
The Mathematical Edge: The premium you collect from selling the 24,200 PE drastically reduces the cost of your 24,400 PE. This lowers your breakeven point and heavily neutralizes the IV crush. Your maximum profit is capped at 24,200, but your probability of walking away green is mathematically much higher.
2: Targeting the High-Beta Laggards
Professional traders rarely short the Nifty 50 directly because it is stabilized by heavyweight defensive stocks (like ITC or Sun Pharma). When the index traps buyers at 24,500, quants immediately look for the "Laggards."
The Setup: Look at the sectoral indices (BankNifty, CNX IT, Nifty Metal) during the initial fake rally. If the Nifty was hitting 24,500 but the Metal sector was already printing red candles, it means institutions were secretly distributing Metal stocks into the index rally.
The Execution: When the Nifty finally breaks down, those weak Metal or highly-leveraged Real Estate stocks will absolutely plummet. You buy Puts or short the futures of these specific high-beta constituents. They provide 3x the downside delta compared to the broader index.
3: The Call Ratio Backspread (The Black Swan Play)
If the 24,500 breakdown is driven by a massive, unpredictable geopolitical event (e.g., sudden military escalation in the Middle East), standard spreads might not offer enough leverage.
The Setup: A Call Ratio Backspread is a bearish strategy that pays off massively in a market crash, but has zero downside risk if the market suddenly reverses and moons.
The Execution: You sell 1 In-the-Money (ITM) Call and buy 2 or 3 Out-of-the-Money (OTM) Calls to finance the trade for a net credit. It is complex to manage, but in a true black-swan crash, the ITM Call you sold expires worthless, and you keep the premium.
Phase 1: The Open Interest (OI) Reality Check
Price tells you what happened. Open Interest tells you what is going to happen.
When the Nifty crosses 24,500, you must immediately open the Option Chain and look at the Call Writers (Option Sellers) at the 24,500 and 24,600 strikes.
The Genuine Breakout: If the Call writers at 24,500 panic and close their positions (Short Covering), you will see massive negative OI change at that strike. This short-covering fuels the rally to 24,700.
The Bull Trap: If the Nifty crosses 24,500, but the Call OI at 24,500 and 24,600 increases, it means institutional money is aggressively selling Calls into the rally. They are confident the price will be crushed back down. Do not buy this breakout.
Phase 2: The FII Derivative Data
Foreign Institutional Investors (FIIs) drive the macro trends in India. You must analyze their daily Long/Short ratio in index futures.
The Setup: Suppose the Nifty breaks 24,500, but the daily NSE data reveals that FIIs are net short on index futures and are heavily buying Index Puts.
The Reality: FIIs are using the artificially high prices (driven by retail FOMO) to build massive short positions. They are anticipating a geopolitical shock or a global macroeconomic correction to act as the catalyst for a sudden dump.
Phase 3: The Geopolitical Overhang
Technical analysis does not exist in a vacuum. As we discussed in the Strait of Hormuz analysis, global macro dictates the ultimate capital flow. Even if the domestic earnings season is stellar, the 24,500 level sits right at the edge of global vulnerability. If US inflation data runs hot (delaying Fed rate cuts) or Middle Eastern tensions flare up, foreign capital will instantly pull out of emerging markets. A breakout engineered during high global geopolitical tension is almost always a trap.
Execution Strategy: How to Trade the 24,500 Level
Professional traders do not guess; they react to confirmation. Here is the exact playbook for this level:
Do Not Buy the Initial Break: Let the 15-minute or hourly candle close above 24,500.
Wait for the Retest: A genuine breakout will always come back down to "retest" the 24,500 level. What was once resistance must now act as support.
Deploy the Iron Condor (Neutral/Bearish): If OI and VIX data suggest a trap, do not short the market naked. Deploy an Iron Condor or a Call Credit Spread above 24,600. If the market fakes out and drops, you keep the premium. If it genuinely breaks out, your risk is strictly capped.
Conclusion: Respect the Smart Money
Anyone can draw a horizontal line at 24,500. But reading the institutional footprints hidden in the Option Chain and FII data is what separates profitable traders from liquidity providers. Validate the breakout with volume, check the geopolitical weather, and never trade against the Open Interest.
💡 The VIX Divergence Warning:
A Nifty breakout paired with a rising India VIX is a massive red flag. It signals institutions are secretly buying Puts to hedge for a sudden crash.
A price breakout without volume and Open Interest support is just a trap. Always cross-reference the spot chart with the NSE Option Chain and institutional FII data before deploying capital into a breakout trade.
