Decoding the Option Chain: How to Spot Institutional Support and Resistance
Charts tell you what happened in the past; the Option Chain tells you what institutions are defending right now. Stop guessing where BankNifty will reverse. Learn how to decode Open Interest (OI), track the "Smart Money," and mathematically pinpoint institutional support and resistance levels.

The Illusion of the Price Chart
Most retail traders rely entirely on price charts. They draw horizontal lines connecting old peaks and valleys, hoping the market will respect a "Support Level" from three weeks ago. In the algorithmic, high-frequency Indian market of 2026, relying solely on historical price action is a surefire way to get trapped.
If you want to know where the market is actually going to stop and reverse today, you must follow the institutional capital. That capital leaves a massive, undeniable footprint: The Option Chain.
To decode it, you must fundamentally flip your perspective. You cannot look at the Option Chain like a retail buyer; you must look at it like an Institutional Seller.
Rule #1: Think Like the Casino (The Seller's Perspective)
When a retail trader has ₹10,000, they buy an option, hoping it goes up. When an institution has ₹10,000 Crore, they sell (write) options, collecting the premium and hoping it expires worthless.
Option selling requires massive margin (roughly ₹1 Lakh per lot for BankNifty). Therefore, when you see a huge buildup of data on the Option Chain, you are looking at the combined financial willpower of institutional money.
Call Sellers (The Bears): They want the market to stay below their strike price.
Put Sellers (The Bulls): They want the market to stay above their strike price.
Concept 1: Implied Volatility (IV) Skew
If you look at the BankNifty option chain, you will notice something mathematically strange. Even if the index is exactly at 55,000, the 54,500 Put (500 points away) is almost always more expensive than the 55,500 Call (500 points away).
Why? Because fear is priced higher than greed. Institutions buy deep Out-of-the-Money (OTM) Puts to insure their massive multi-crore portfolios against flash crashes. This constant demand for Puts keeps their Implied Volatility (and therefore their price) artificially high. This is known as the standard IV Skew or "Volatility Smile."
The Reversal Signal: The "Call Skew"
The standard skew is bearish/protective. However, you must monitor the chain for anomalies.
The Setup: Suddenly, OTM Calls become more expensive than OTM Puts equidistant from the spot price.
The Meaning: Institutional funds are aggressively buying upside exposure. They are anticipating a massive breakout (perhaps a leaked corporate earnings report or a dovish RBI policy).
The Action: When the IV Skew flips to favor calls, do not try to short the market. The Smart Money is positioning for a violent upward thrust.
Concept 2: The "Max Pain" Theory
Why does BankNifty so frequently expire exactly at a strike price that renders 90% of retail options completely worthless? It is not a coincidence; it is Max Pain.
The "Max Pain" price is the specific strike price at which the highest number of open options (both Calls and Puts) will expire Out-of-the-Money (worthless).
The Mechanics: Institutional option sellers (the "writers") write massive quantities of options across various strikes. As Thursday expiry approaches, they mathematically calculate the exact index price that will cause the maximum financial loss ("pain") to the retail option buyers.
The Execution: Because these institutions hold billions of rupees in the cash market (actual shares of HDFC, ICICI, etc.), they will aggressively buy or sell the underlying stocks on Thursday afternoon to "pin" the BankNifty index as close to the Max Pain strike as possible.
Concept 3: Volume vs. Open Interest Discrepancies
Many traders confuse Volume with Open Interest. Volume is vanity; OI is sanity. However, analyzing them together reveals institutional intent.
Scenario | Data Signature | What the Smart Money is Doing |
New Accumulation | High Volume + Rising OI | Institutions are aggressively opening new positions. The trend is strong and validating. |
Short Covering (Panic) | High Volume + Falling OI | The "Gamma Blast." Institutions are closing losing positions. Expect a violent, fast breakout. |
Intraday Speculation | High Volume + Flat/Low OI | Pure retail day-trading noise. No institutional positions are being held overnight. Ignore this strike. |
Long Unwinding | Low Volume + Falling OI | The bulls are quietly packing up and leaving. Momentum is dying; prepare for a reversal. |
Decoding the Matrix: Open Interest (OI) vs. Volume
When you open the NSE Option Chain, you will see a blinding wall of numbers. Ignore 90% of it. Focus entirely on Open Interest (OI) and Change in OI.
Volume: How many times a contract was traded today. (Good for measuring daily hype).
Open Interest (OI): How many contracts are currently open and being held overnight. (The true measure of institutional conviction).
Finding the "Iron Walls"
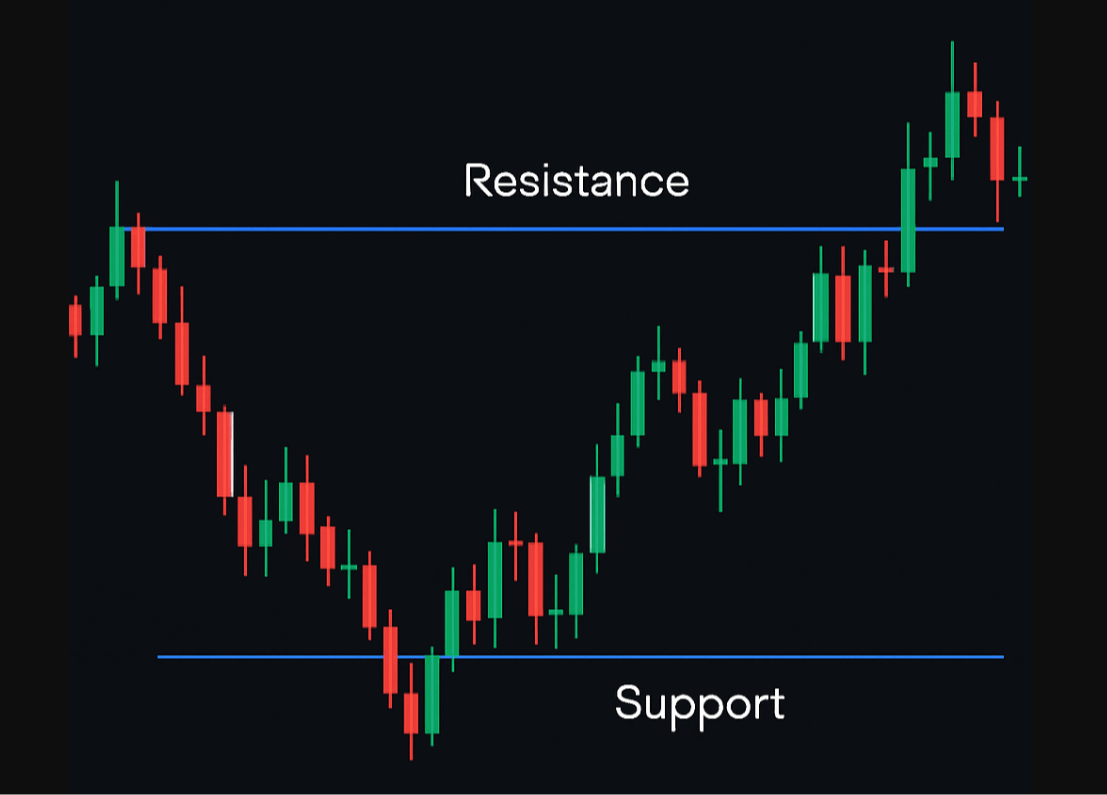
The Resistance Wall (Highest Call OI): Look down the "Call" side of the chain. The strike price with the highest Open Interest is your ultimate Resistance level. Institutions have sold millions of calls here, and they will aggressively short the cash market to prevent the index from crossing this line.
The Support Wall (Highest Put OI): Look down the "Put" side. The strike price with the highest Open Interest is your ultimate Support level. Institutions will deploy massive capital to buy the dip and defend this zone.
The "Change in OI" Trigger: Spotting the Breakout
The Option Chain is dynamic. Knowing the Support and Resistance is great for range-bound days, but the real money is made when those levels break. This is where Change in OI becomes your crystal ball.
The Short Covering Rally (The Gamma Blast)
Let’s say BankNifty is at 55,200. The highest Call OI is at 55,500. This is your Resistance. Suddenly, a positive global news event hits, and BankNifty spikes to 55,450.
What to watch: Look at the Change in OI column for the 55,500 Call. If you see massive negative numbers (OI shedding), it means the institutions are panicking. They are buying back their short positions at a loss.
The Action: This panic buying triggers a "Short Covering" rally. The index won't just touch 55,500; it will slice right through it and violently spike to 55,800. If you see Call OI dropping rapidly, you buy the breakout.
The Long Unwinding (The Trap Door)
Conversely, if the highest Put OI (Support) is at 55,000, and the market drops to 55,050.
What to watch: If the Change in OI for the 55,000 Put turns negative, the Bulls have given up. They are closing their positions.
The Action: The floor is about to collapse. The index will violently break 55,000 and flush downwards.
"Support and Resistance on a chart are just lines drawn in the sand. Support and Resistance on the Option Chain are concrete walls built with billions of rupees."
The 9:30 AM Option Chain SOP
Never look at the Option Chain at 9:15 AM. The data is leftover from yesterday and completely skewed by overnight gap orders. Here is your daily routine:
9:30 AM: Open the Option Chain. Find the highest Call OI and highest Put OI. Draw these two lines on your TradingView chart. This is your trading range for the day.
11:00 AM Check-in: Is the OI shifting? Are institutions building a new, closer wall? Adjust your lines.
2:00 PM Breakout Watch: As theta decays, institutions will defend their strikes aggressively. Any sudden unwinding (negative Change in OI) after 2:00 PM is a high-probability breakout trade.
Conclusion: Trade the Math, Not the Emotion
When you learn to read the Option Chain, you stop hoping the market will reverse and start seeing exactly where it has to reverse. By tracking Open Interest, you align your small retail capital directly behind the massive shields of institutional Option Sellers.
💡 The "Kill Switch" Protocol:
Never buy far Out-of-the-Money (OTM) options on a Wednesday afternoon expecting a Thursday miracle. Time decay (Theta) accelerates exponentially in the final 24 hours. You are mathematically guaranteed to lose your premium if the index simply stays flat.
Institutions use the Option Chain to defend their massive portfolios. Use SEBI's T+0 settlement to quickly pivot your capital the moment you see institutional Open Interest (OI) shifting on the live tape.